
Final Verified Multi-Year Comparison 2019-2023 (Actuals)
| Category | 2023 | 2022 | 2021 | 2020 | 2019 |
|---|---|---|---|---|---|
| Revenue | |||||
| Food & Beverage Revenue | $1,283,846 | $1,164,874 | $1,084,792 | $371,321 | $1,201,290 |
| Total Revenue | $1,283,846 | $1,164,874 | $1,084,792 | $371,321 | $1,201,290 |
| Food and Beverage Costs | $445,227 | $414,336 | $288,396 | $169,085 | $372,347 |
| Gross Margin | $838,619 | $750,538 | $796,396 | $202,236 | $828,943 |
| Expenses | |||||
| Salaries and Benefit Reimbursements | $902,600 | $882,219 | $731,815 | $526,346 | $594,398 |
| Supplies and Maintenance | $68,256 | $71,593 | $75,182 | $51,961 | $99,546 |
| Sales and Marketing | $46,708 | $33,609 | $38,233 | $24,042 | $40,127 |
| Utilities | $57,474 | $52,889 | $45,312 | $40,249 | $45,504 |
| Management Fees | $31,119 | $71,909 | $52,724 | $51,060 | $51,060 |
| Insurance | $70,431 | $27,308 | $43,652 | $35,854 | $33,258 |
| Real Estate Taxes | $17,375 | $15,206 | $14,992 | $15,066 | $15,108 |
| Equipment Rentals and Leases | $20,217 | $13,026 | $20,547 | $11,621 | $19,348 |
| Bank Fees | $41,471 | $30,340 | $24,069 | $11,297 | $22,249 |
| Janitorial | $80,513 | $74,967 | $33,057 | $14,664 | $20,497 |
| Computer Support | $8,513 | $12,032 | $17,854 | $17,787 | $17,764 |
| Entertainment/Promotion | $9,327 | $11,153 | $7,800 | $2,365 | $17,695 |
| Miscellaneous | $16,776 | $14,589 | $8,973 | $5,948 | $11,790 |
| Permits and Fees | $7,817 | $8,812 | $7,389 | $8,736 | $8,001 |
| Office, Printing and Postage | $13,706 | $11,418 | $13,041 | $16,315 | $14,153 |
| Trash Removal | $2,276 | $2,723 | $2,970 | $2,740 | $3,089 |
| Uniforms | $2,279 | $918 | $1,988 | $1,513 | $2,430 |
| Member Relations | $0 | $32 | $0 | $0 | $0 |
| Legal Fees | $0 | $0 | $2,304 | $69 | $67 |
| General F&B Operations | $0 | $0 | $0 | $0 | $0 |
| Total Expenses | $1,396,858 | $1,334,743 | $1,139,902 | $837,633 | $1,016,084 |
| Net Surplus/(Deficit) | $(558,239) | $(584,205) | $(343,506) | $(635,397) | $(187,141) |
| Budgeted Dues Subsidy | $223,711 | $137,457 | $147,428 | $211,064 | $187,074 |
Notes:
- Consistent Operating Losses: The F&B operation has consistently operated at a significant deficit across all years (2019-2023), requiring substantial subsidies from homeowner assessments to maintain operations.
- Revenue Recovery: After the significant revenue drop in 2020 ($371,321) due to COVID-19 pandemic restrictions, revenue has steadily increased each year, reaching $1,283,846 in 2023, which exceeds pre-pandemic levels.
- Cost Structure: Labor costs (Salaries and Benefit Reimbursements) represent the largest expense category, averaging around 40-60% of total revenue, which is typical for food service operations but creates a challenging cost structure.
- Operational Subsidy: The community has structured its financial model to provide ongoing operational subsidies for the F&B operations from homeowner assessments, indicating it views these amenities as a community benefit rather than a profit center.
- Cost Inflation: Several expense categories show significant increases over the 5-year period, particularly in 2022-2023, reflecting industry-wide inflation in food costs, labor, and utilities.
- Management Fees: These fees fluctuated significantly over the period, decreasing from $71,909 in 2022 to $31,119 in 2023, suggesting possible changes in management structure or contracts.
- Insurance Costs: Insurance expenses increased dramatically from $27,308 in 2022 to $70,431 in 2023 (+158%), significantly exceeding inflation and potentially indicating broader insurance market challenges or specific risk factors.
- Expense Variability: Certain expenses show significant variability year-to-year, suggesting either classification changes, operational adjustments, or potentially one-time costs being allocated inconsistently.
- Subsidy Gap: In recent years (2022-2023), there has been a growing gap between the actual deficit and the budgeted subsidy, which may require additional financial planning or operational adjustments to address.
- Hospitality Industry Context: The performance should be viewed in the context of broader challenges facing the hospitality industry, including labor shortages, supply chain disruptions, and changing consumer preferences particularly affecting community association amenities.
[siteorigin_widget class=”SiteOrigin_Widget_Headline_Widget”][/siteorigin_widget]
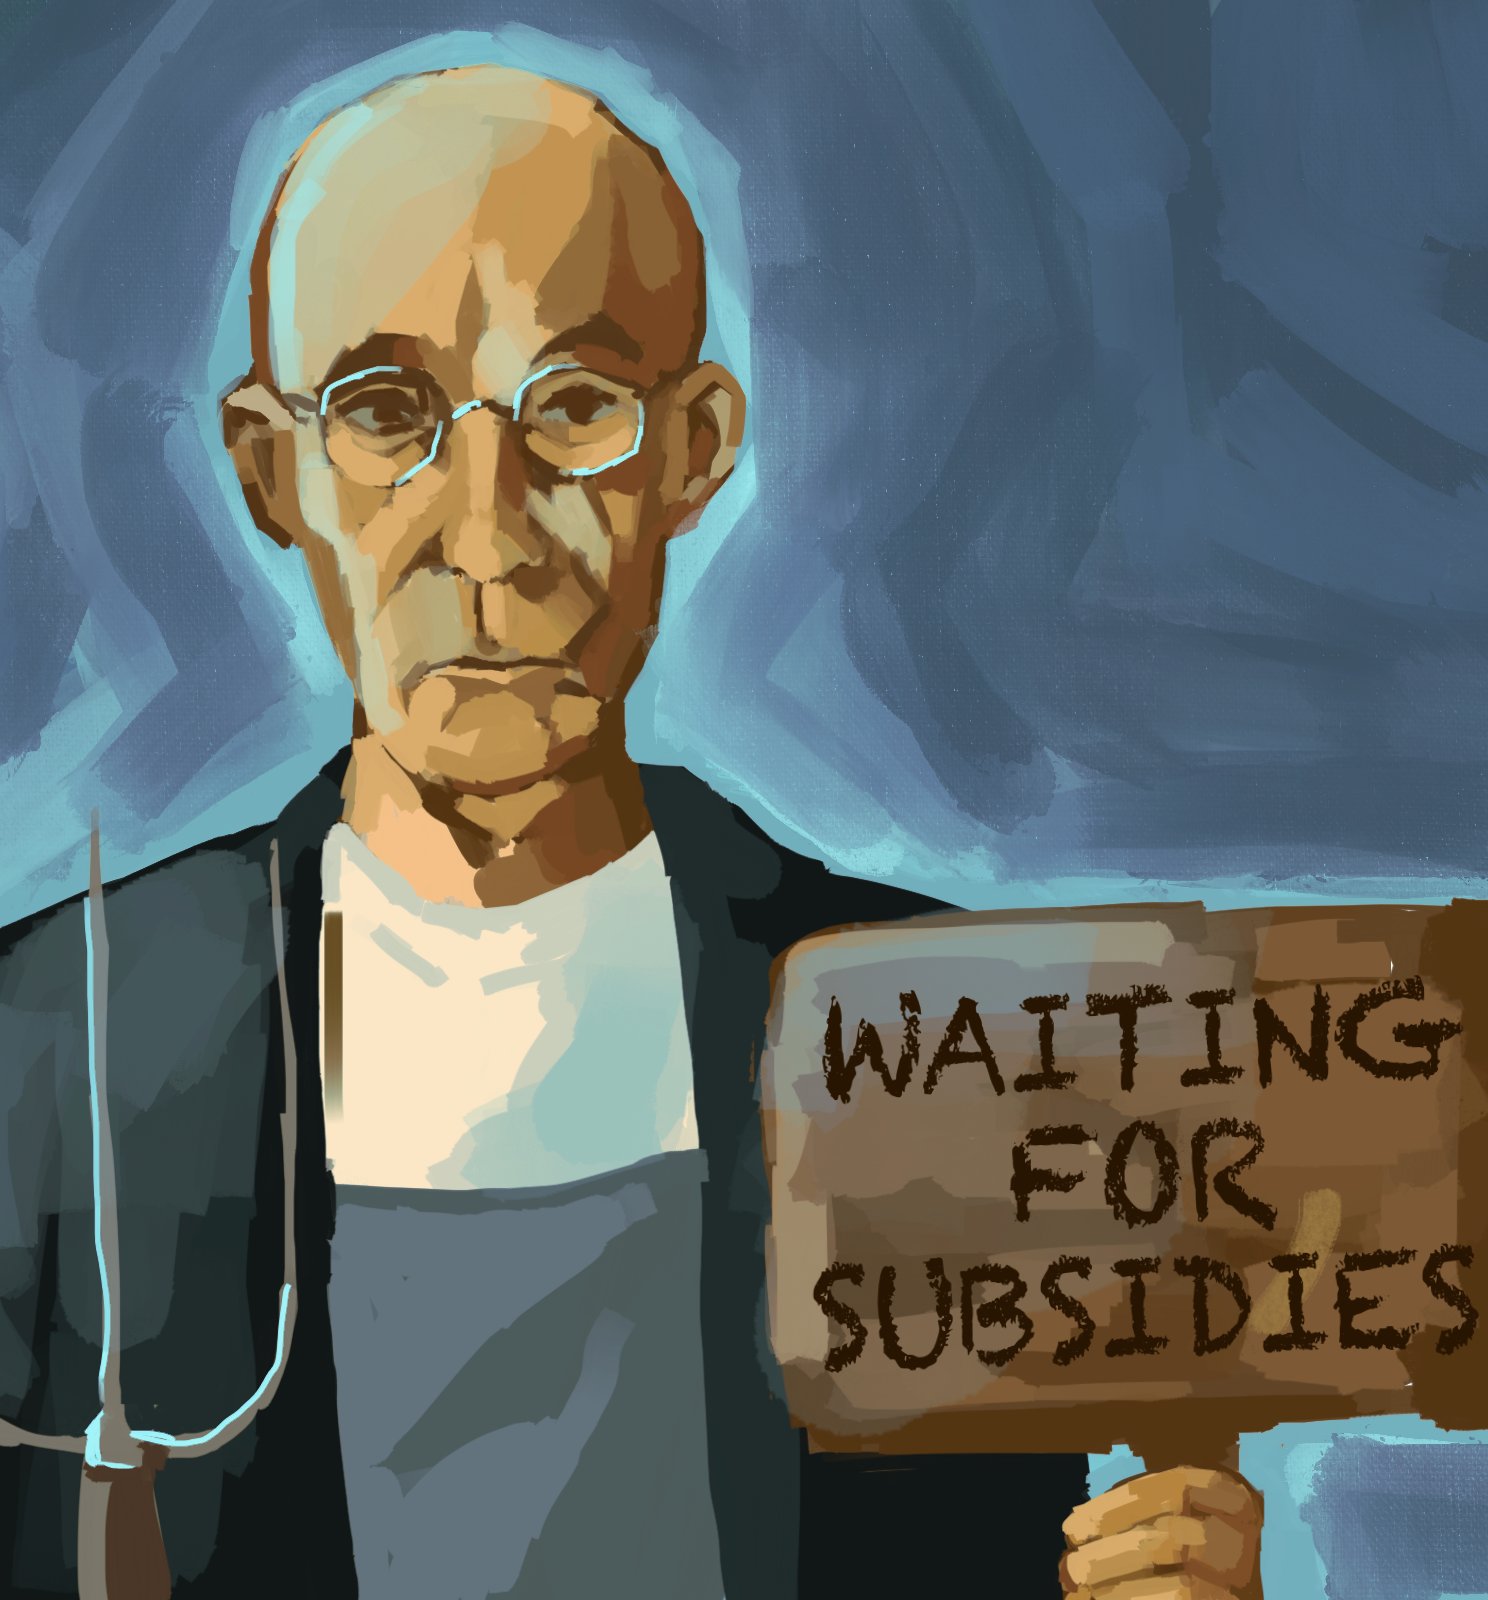
Food for Thought
- Non-diners are picking up a substantial portion of the tab for restaurant operations they may never use, with a projected 20-year cost potentially exceeding $7,000 per household. That’s quite the check to split!
- The F&B operation has consistently required the largest subsidy among all amenities – taking the biggest bite out of homeowner dues.
- The 2020 pandemic year saw the highest losses, but even in “good” years, the operation has failed to break even.
- The subsidies have been on a roller-coaster ride, making it difficult to predict future costs. Talk about an unpredictable recipe!
- When compared to the golf operations, F&B requires more than double the subsidy – approximately 70% of total amenity subsidies come from F&B operations versus 30% for golf.
- Revenue has rebounded strongly since the pandemic, from $371,321 in 2020 to $1,427,642 in 2024, but expenses have risen in proportion, preventing the operation from achieving profitability.
This P&L is based on the detailed supplemental information from the audited financial statements.

[siteorigin_widget class=”SiteOrigin_Widget_Image_Widget”][/siteorigin_widget]


Leave a Reply